Listed as Free on Udemy when checked on 7 November 2026. No coupon or subscription trial is required for the listed lessons. Enrollment needs a Udemy account; availability can change.
About this course
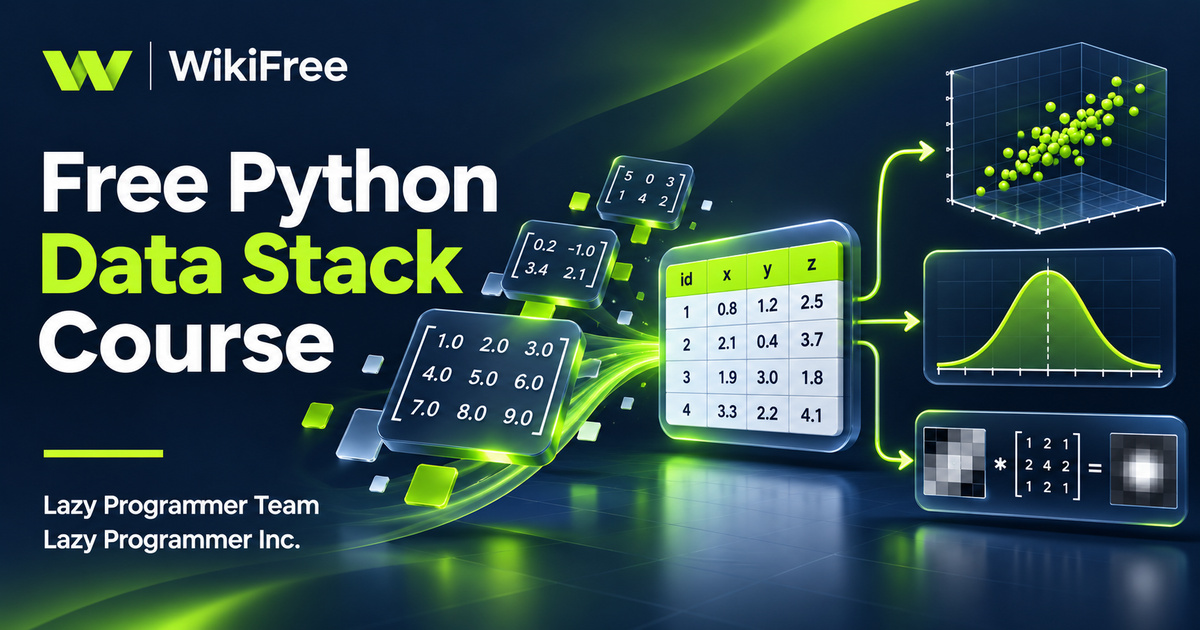
Before a machine-learning model can do anything useful, its inputs need a workable representation. This free Python data stack course brings together NumPy, Matplotlib, pandas and SciPy to help you move between numerical arrays, tables and visual explanations. Lazy Programmer Team and Lazy Programmer Inc. present the tools as preparation for later algorithm study.
The public course, Deep Learning Prerequisites: The Numpy Stack in Python V2, contains twenty-seven videos across six sections, totaling one hour, fifty-nine minutes and five seconds. Three introductory quizzes are also listed. Its sequence covers course logistics, NumPy, Matplotlib, pandas, SciPy and an appendix. The listing was updated in February 2026.
You should already understand Python programming, linear algebra and probability. Although Udemy labels the source All Levels, this is a better fit for someone ready to apply those foundations than for a first encounter with programming. The emphasis is preparing data and expressing mathematical operations, with machine-learning algorithms positioned as a subsequent step.
| Official course | Deep Learning Prerequisites: The Numpy Stack in Python V2 |
|---|---|
| Created by | Lazy Programmer Team; Lazy Programmer Inc. |
| Platform | Udemy |
| Language | English |
| Level | Intermediate |
| Listed duration | 119 minutes; 27 lectures across 6 sections |
| Completion terms | Not included with a new free enrollment |
What you’ll learn
Connect Python lists with numerical arrays, calculate dot products and work with matrices. Load and select tabular data with pandas, choose plots that answer a question, and explore probability functions and image convolution through SciPy. Use the section exercises to turn short demonstrations into your own explanations and experiments.
Skills you’ll gain
- NumPy matrix operations
- Linear-system awareness
- Matplotlib visualization
- pandas table selection
- Probability-function interpretation
- Image convolution foundations
Give numerical operations a clear meaning
The NumPy section starts with arrays versus lists, then develops dot products, matrix operations, linear systems and generated data. These topics share a useful habit: decide what each axis represents before calculating. Elementwise multiplication, a dot product and matrix multiplication express different operations. Matching dimensions is necessary, but you also need to check whether the calculation makes sense for your data.
A dedicated timing example and a matrix-multiplication exercise encourage comparison with list-based implementations. Treat the results as measurements of particular operations and inputs, rather than a promise that every NumPy expression will be faster. The linear-systems lesson introduces linalg.solve instead of explicitly forming an inverse. That solver expects a square, full-rank coefficient matrix; other systems require an appropriate alternative.
Choose a plot for the question
Matplotlib gives those arrays a visual form through line charts, scatter plots, histograms and displayed images. Choose the chart around the question: a line can show a changing quantity, a scatterplot can compare paired measurements, and a histogram can reveal the distribution of values. Changing histogram bins changes the presentation, so compare choices before drawing a conclusion from the picture.
The plotting exercise uses an XOR-style arrangement of points. It offers a compact way to practice coordinates and visual grouping without requiring a trained classifier. Image plotting also introduces the idea that a picture can be represented as an array. Simple channel averaging is one demonstration of combining channels, not a universal rule for perceptually accurate grayscale conversion.
Work deliberately with labeled tables
Pandas then adds labels and table-oriented operations. The lessons cover loading data, selecting rows and columns, applying functions, plotting and exporting a small derived dataset. Keep label-based loc selection separate from position-based iloc selection. A row label that happens to be an integer still carries a different meaning from its physical position in the table.
The apply lesson provides another way to express a calculation across rows or columns. It does not make an arbitrary Python function automatically vectorized or faster. First make the transformation clear, then choose an appropriate built-in operation or measure alternatives when performance matters. For exported files, deliberately choose whether headers and index labels belong in the result.
Add probability and image operations
SciPy rounds out the stack with normal-distribution functions and convolution. Keep probability density and cumulative probability distinct: a PDF value describes density, while a CDF gives probability up to a threshold. The image exercises move toward blurring and edge detection with small filters. These are numerical image operations; they do not amount to training a neural network.
Connect the tools in a small experiment
For your own practice, create a small table of daily readings, select a date range, compute a useful summary and plot the result. Explain why you chose those labels, array shapes and chart type. Then deliberately reorder the table and compare label selection with positional selection. This suggested activity links the tools without depending on a large dataset or a hosted service.
The recorded lessons are listed as free. The four core libraries are open source, while any hosted environment you choose has separate account and usage terms. Work through the named section exercises at your own pace, and distinguish this free V2 course from separately advertised programs. Use the foundation to prepare for further study without expecting a professional qualification, guaranteed certificate or complete deep-learning curriculum.
Related courses for your next step
- Connect table operations with familiar queriesFree SQL to Python pandas Course
Explore how SQL-style data questions translate into pandas operations.
Beginner
Frequently asked questions
Does this course teach deep-learning algorithms?
Its focus is the Python data tools needed before studying those algorithms. NumPy, Matplotlib, pandas and SciPy are the central subjects.
What should I know before starting?
The course lists Python programming, linear algebra and probability as prerequisites. It is most useful when you can already follow those foundations.
Are the section exercises coding assignments?
The named NumPy, Matplotlib, pandas and SciPy exercises are video lessons. Three introductory quizzes are listed separately; this article does not promise graded assignments or a certificate.
Questions & discussion
Share a useful question or correction. Comments appear after moderation. Please avoid personal or sensitive information.