Path 69 · The evidence newsroom · Beginner
Make the comparison understandable.
A guided, practical route through data storytelling.
What you will be able to do
Create a three-chart narrative that explains a service change, uses honest denominators and ends with a supported decision.
Plan about 9h 21m in total. Reading and practice are editorial estimates; video runtimes come from public provider metadata. Your pace will vary.
Table of Contents
Before you begin
Check your starting point
What you need
Basic percentages and a spreadsheet or browser. Supplied data are synthetic; no design subscription is needed.
The selected public provider lessons are free to view. The original case can be completed with paper, a text editor or freely available local tools. Paid exams, certificates, subscriptions and optional provider software are not required for this project.
Completing this Coursya path does not award a provider certificate. Any provider assessment, account requirement or credential must be checked separately on its official page.
Three readiness questions
Can a count rise while its rate falls?
Yes, when the denominator grows enough.
Does before–after prove causation?
No.
What should a chart title communicate?
A specific comparison supported by the plotted data.
Use a workable pace
At 5 hours per week, allow about 2 weeks. Start with Stage 1, continue in order and reserve 2h for the capstone. If a gate fails, use its repair step before advancing. At another weekly budget, divide 561 estimated minutes by your available weekly minutes and round up.
Keep a small evidence folder. A checked box means you reviewed your output; it is not a certificate or proof that a provider lesson was watched.
The working case
Counts and rates tell different parts
A fictional library compares help-desk activity before and after a new booking form. The later period has more requests, so raw failure counts alone are misleading. The case supports descriptive comparisons, not a causal claim about the form.
| Period | Requests | Resolved on first contact | Reopened |
|---|---|---|---|
| Before | 100 | 70 | 12 |
| After | 160 | 120 | 16 |
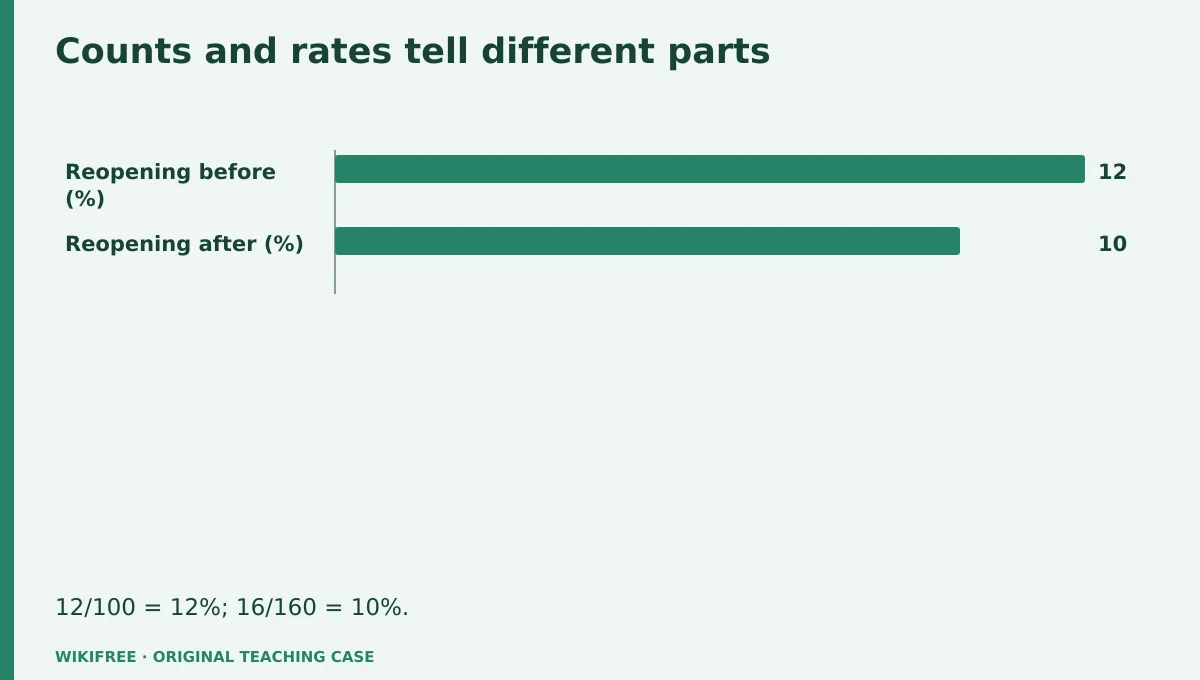
The table and explanations preserve the essential case information when the diagram is unavailable.
Your route
Five outputs, then a final handoff
- 01Choose a decision questionStory brief
About 1h 40m including assigned learning and practice. - 02Calculate comparable measuresMetric table
About 1h 5m including assigned learning and practice. - 03Design honest chartsThree-chart draft
About 2h 1m including assigned learning and practice. - 04Connect the narrativeNarrative with decision
About 1h 25m including assigned learning and practice. - 05Rehearse questionsReview log
About 1h 12m including assigned learning and practice. - FINALCapstone reviewCombine the evidence into one inspectable handoff.
About 2h .
0 of 6 outputs checked. JavaScript adds browser-only progress saving.
The complete lesson and all downloads remain available. Use the printable project workbook to track your progress.
Use the minimum useful source material
The courses behind this route
Free Data Analytics Course: Spreadsheets, SQL and R
Published Google data-analysis lessons cover stories, visualizations, presentations and follow-up questions.
Selected material only; this path does not claim completion of the entire provider course.
Course publication and selected public lesson metadata were checked on 13 October 2026. This is not a claim of full video playback, provider-course completion or permanent availability. Recheck the linked source if a lesson changes.
Learn, make, inspect
The five-stage workshop
Choose a decision question
Video 39m · reading budget 0m · original practice about 1h .
A story begins with a question a reader can answer, not with a favorite chart. Identify the audience, the decision and the evidence available. Keep descriptive statements distinct from explanations of cause. The fictional manager wants to know what improved and what needs further investigation.
Watch these selected lessons
Do the work
Write one decision question and three evidence statements.
Save this output
Story brief
Pass the review gate
No statement attributes the change to the form as a proven cause.
If you need another attempt
Add the missing comparison or remove the causal wording.
Calculate comparable measures
Video 0m · reading budget 0m · original practice about 1h 5m.
Use denominators that match the question. First-contact resolution is resolved requests divided by all requests; reopening rate is reopened requests divided by all requests in this simplified case. Name the denominator because other organizations may define reopening differently. Preserve both counts and rates so volume remains visible.
Original application stage. Use your preceding outputs and the supplied case; there is no additional required provider lesson.
Do the work
Calculate both rates for both periods and reconcile the raw counts.
Save this output
Metric table
Pass the review gate
Resolution is 70% then 75%; reopening is 12% then 10%.
If you need another attempt
Write numerator and denominator beside every percentage.
Design honest charts
Video 46m · reading budget 0m · original practice about 1h 15m.
Choose a chart that makes the comparison easy to inspect. A bar chart normally needs a zero baseline; a rate chart should label percentage units. Avoid 3D effects and decorative scales that exaggerate change. Provide the underlying table and do not rely on color alone to identify the periods.
Watch these selected lessons
Do the work
Create volume, resolution-rate and reopening-rate charts with direct labels.
Save this output
Three-chart draft
Pass the review gate
All plotted values match the table and the comparison remains clear in grayscale.
If you need another attempt
Remove decoration before adding more annotation.
Connect the narrative
Video 25m · reading budget 0m · original practice about 1h .
Sequence context, evidence and implication. Explain that request volume rose while both selected rates improved. A useful narrative also names limitations: sample periods, case definitions and potential changes in request difficulty. The recommendation should be proportionate to the evidence rather than a celebration of an untested explanation.
Watch these selected lessons
Do the work
Write a 300-word narrative and one next investigation step.
Save this output
Narrative with decision
Pass the review gate
The reader can find the denominator and the limitation without reading notes elsewhere.
If you need another attempt
Move essential caveats next to the affected claim.
Rehearse questions
Video 16m · reading budget 0m · original practice about 55m.
Questions reveal where a visual is ambiguous or a claim overreaches. Prepare to explain definitions, arithmetic and missing evidence. If you do not know an answer, record the data needed rather than inventing it. Use feedback to improve the artifact, not to defend every initial design choice.
Watch these selected lessons
Do the work
Answer five likely reviewer questions and revise one chart annotation.
Save this output
Review log
Pass the review gate
Answers distinguish observed values from assumptions and unknowns.
If you need another attempt
Trace each answer to the case table or label it unknown.
Make the result inspectable
Your final project
Deliver the metric table, three charts, narrative, source note and question log. Create one deliberately misleading chart in a separate appendix and explain the specific correction.
The ZIP includes synthetic input data, a project workbook, worked reference, evidence log, scoring rubric and case-specific materials. Code projects include source and clearly stated local execution requirements.
Use one consistent rubric
| Criterion | Maximum | Evidence |
|---|---|---|
| Evidence and correctness | 30 | Calculations, source use and results match the supplied case; limitations are honest. |
| Required artifacts | 30 | All five stage outputs and the capstone handoff are present and inspectable. |
| Reasoning and decisions | 20 | Choices, assumptions, alternatives and the case-specific critical condition are explained. |
| Reproducibility | 10 | A reviewer can follow the stated steps and distinguish expected from observed results. |
| Clear communication | 10 | Labels, units, structure and evidence references make the work easy to review. |
Score at least 80/100, supply every required artifact, and satisfy the path-specific critical condition. Rework missing evidence before marking complete.
The critical condition
Chart values and denominators agree, and descriptive changes are not presented as proven causal effects.
Compare with a worked reference
Requests rose 60%, from 100 to 160. First-contact resolution rose by 5 percentage points, from 70% to 75%. Reopened requests rose from 12 to 16, while the reopening rate fell from 12% to 10%. Both the count and rate statements can be true.
Know the boundary
This is a descriptive communication exercise; it does not estimate statistical significance or causal impact.
Questions before you finish
Do I need to finish every source course?
No. This path names selected lessons or reading sections. Complete the full provider course only if it supports your wider goal. The path does not claim equivalence to that course.
How do I know when to advance?
Use the output and review gate in each stage. If evidence is missing or a result conflicts with the case, follow the repair step and retry before advancing.
Can I do the project without paid software?
The selected public provider lessons are free to view. The original case can be completed with paper, a text editor or freely available local tools. Paid exams, certificates, subscriptions and optional provider software are not required for this project.
What does my checklist prove?
It records your own review in this browser only. It does not verify viewing, skill, a provider credential or a real-world deployment.
What if a lesson or tool changes?
Use the linked course and provider page to inspect current availability. Record the change and revisit the relevant assignment; do not invent a replacement lesson or claim an unavailable activity was completed.
Questions & discussion
Share a useful question or correction. Comments appear after moderation. Please avoid personal or sensitive information.