Free Python Data Analysis and Interactive Charts Course
A useful data analysis needs more than an attractive chart. The data must be organized, the transformations must make sense, and another person should be able to…
BeginnerRead details
Explore free study options. Check the provider, prerequisites, and certificate details before you begin.
94 courses
A useful data analysis needs more than an attractive chart. The data must be organized, the transformations must make sense, and another person should be able to…
A spreadsheet can make a short list easy to read. When the same report must be rebuilt every week, a Python script makes the decisions behind the…
A useful analysis often starts with repairing the table rather than choosing a chart. This course follows that preparation work in Excel's Power Query Editor, using a…
A useful data query starts with a question that is specific enough to answer. Which records belong in the result, and which should be left out? Max…
Looking at channel numbers is easier than deciding what they say about a particular video. Vova Even’s YouTube analytics course takes a guided-tour approach, using his own…

Richard Evans’s An Introduction To Game Analytics explains where analysis fits inside a video or mobile game studio. Rather than beginning with query syntax, it connects player…
Before contract information can support a useful dashboard or decision, someone needs to decide what the data represents and whether it is reliable. Thaija “Thai” Dickerson’s introductory…
A baseball chart depends on several earlier decisions: which events were extracted, how dates and results were interpreted, and which rows belong to each player. Charles Redmond’s…
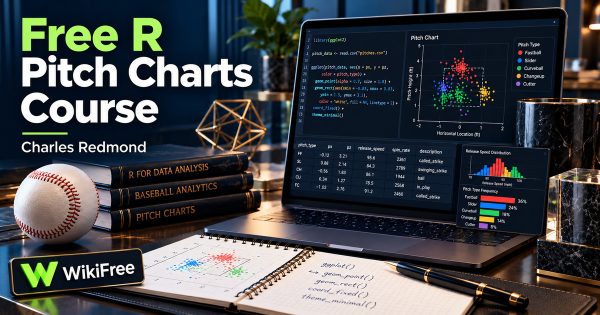
A pitch-location chart can show more than where a baseball crossed the plate. This free R course develops visualizations of pitch type, speed, sequence and at-bat context,…
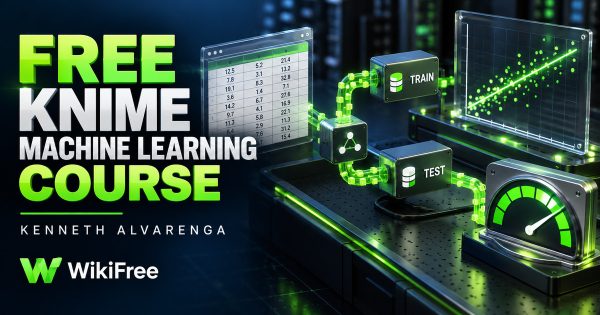
Machine learning can be introduced through a visual workflow before a learner writes code. This free course uses KNIME to connect spreadsheet data, graphs, partitions, a linear…
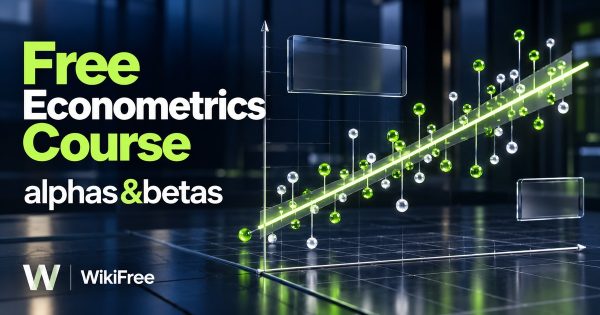
alphas &betas offers a compact introduction to regression models and ordinary least squares. The course begins with simple and multiple regression, then separates slope, intercept and error…

Vova Even presents MerchantSpring as a reporting layer for sellers, vendors, brands and agencies that monitor more than one marketplace account. The lessons move from software structure…
May we use Google Analytics to understand visits and improve our free learning resources? Analytics stays off until you choose Allow. You can change your choice at any time. Privacy details