Listed as Free on Udemy when checked on 7 November 2026. No coupon or subscription trial is required for the listed lessons. Enrollment needs a Udemy account; availability can change.
About this course
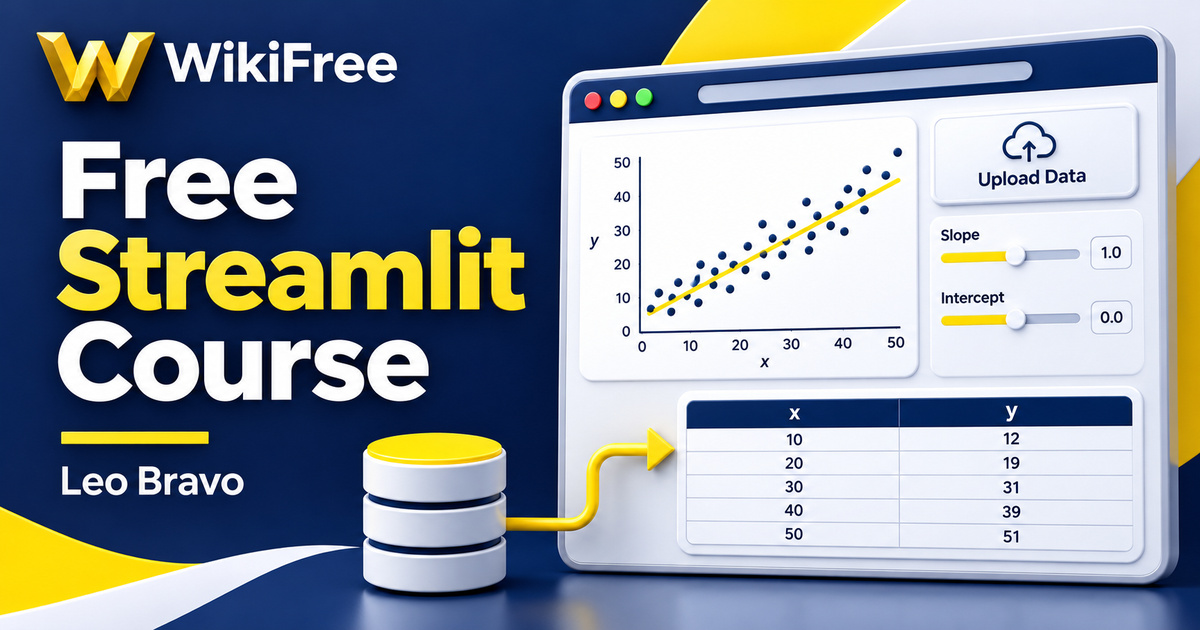
A Python analysis can answer a question while still being awkward for someone else to use. They may need to choose a file, enter a number or inspect a result without editing your notebook. This free Streamlit course explores that transition: taking a small local data analysis workflow and giving it an interface that responds to user input.
Leo Bravo builds the analysis first and then adapts it into a web app. The project combines tabular data, visual exploration, linear regression and predictions. You can follow the relationship between a computation and its interface instead of treating the page as decoration added at the end. Basic Python knowledge is required; prior data science or web development knowledge is not listed as necessary.
| Official course | Build a Data Science web app using Streamlit |
|---|---|
| Created by | Leo Bravo |
| Platform | Udemy |
| Language | English |
| Level | Beginner |
| Listed duration | 110 minutes; 13 lectures across 3 sections |
| Completion terms | Not included with a new free enrollment |
What you’ll learn
Follow a project from reading a dataset to displaying descriptions and plots, training a regression model and accepting an input for prediction. Then see how titles, messages, a sidebar and file upload connect those steps inside Streamlit. The useful outcome is understanding the flow of a small demonstration app, including where data enters, where calculations happen and how the result reaches the screen.
Skills you’ll gain
- Streamlit interface building
- Python workflow adaptation
- Data upload and inspection
- Scatter plot interpretation
- Regression workflow reasoning
- Interactive prediction inputs
Follow the analysis before the interface
The course contains 13 videos across three sections, totaling about 110 minutes. It starts with Streamlit and a basic web app, moves into a local data science project, and then converts that workflow into an interactive page. The final section adds file reading, descriptive displays, plots, model training, prediction and user interaction before a short discussion of deployment.
As you work through the sequence, keep a simple map of the project: input data, selected columns, analysis, fitted model and displayed result. Check what each stage expects from the previous one. This makes it easier to distinguish a file-reading problem from a modeling problem or a presentation issue. The Python libraries named in the course include pandas, NumPy, scikit-learn and Matplotlib.
Connect each control to a clear result
A useful interface makes its choices visible. A file upload selects the data to inspect; an input field supplies a value; a plot communicates the output. Ask which step should happen after each interaction and what should be shown before a file is available. You do not need to promise a full production service to learn from connecting these small pieces.
For an optional practice task, sketch a page with three areas: a dataset preview, an input control and a result plot. Label the information that each area consumes and produces. Then trace what should change when the input changes. This is an editorial study exercise, not an advertised course assignment. Current Streamlit documentation describes full-script reruns as the default behavior, with forms and fragments offering other execution patterns.
Treat the prediction as a model output
Linear regression supplies a concrete example for the app, but an attractive chart does not establish reliable predictions. Distinguish data used to fit a model from data used to assess it. Scikit-learn warns that letting test information influence training can make performance look better than it is. Treat the course as an introduction to the workflow, without assuming that the demonstration validates a model for operational decisions.
Also separate the mathematical idea from a particular software implementation. Scikit-learn documents its LinearRegression estimator as ordinary least squares; do not assume that every linear regression implementation trains through gradient descent. When following older examples, check the estimator and library version actually used, then compare the relevant documentation. This keeps an introductory explanation from becoming an unsupported claim about all models.
Keep the project and deployment scope clear
The recording was last updated in February 2021, so some commands or interfaces may differ from current releases. Its closing deployment discussion lasts under four minutes. Use that as orientation about moving beyond a local machine, rather than expecting a complete hosting, access-control or maintenance procedure. Hosting services and optional tools have their own terms and costs, separate from free access to the listed lessons.
The listing advertises one downloadable resource, and the lecture descriptions mention a code archive and optional slides obtained through a separate subscription form. The lesson offer should not be confused with a promise that every supplementary item is accessible without an additional step. You can judge the course by its demonstrated learning scope: a small interactive data app, not a guaranteed accurate forecasting service, professional qualification or deployment-ready product.
Streamlit data flow: Read the current explanation of reruns and interface updates. Model evaluation pitfalls: Review training and test separation before evaluating predictions.
Related courses for your next step
- Refresh dataframe operationsFree Python pandas Course
Review Series and DataFrames before connecting a dataset to a page.
Beginner
- Strengthen Python basicsFree Python Variables, Decisions and Loops Course
Revisit the language foundations used in an interactive script.
Beginner
Frequently asked questions
Do I need previous machine learning experience?
The instructor requires basic Python knowledge and does not require prior data science or machine learning knowledge.
Does the course include a complete deployment walkthrough?
The public outline ends with a short discussion of deployment. Do not treat it as a complete production hosting or maintenance guide.
Are the optional slides part of the lesson access?
The public descriptions direct learners to a separate subscription form for slides. That optional material is distinct from the listed free video lessons.
Questions & discussion
Share a useful question or correction. Comments appear after moderation. Please avoid personal or sensitive information.