Path 65 · The flow observatory · Beginner
Separate service time from time spent waiting.
A guided, practical route through service queue analysis.
What you will be able to do
Simulate a single-server queue from supplied arrivals, measure waiting time and test a second-server scenario.
Plan about 8h 30m in total. Reading and practice are editorial estimates; video runtimes come from public provider metadata. Your pace will vary.
Table of Contents
Before you begin
Check your starting point
What you need
Spreadsheet formulas or basic Python. Times are minutes from an arbitrary start; no probability background is needed.
The selected public provider lessons are free to view. The original case can be completed with paper, a text editor or freely available local tools. Paid exams, certificates, subscriptions and optional provider software are not required for this project.
Completing this Coursya path does not award a provider certificate. Any provider assessment, account requirement or credential must be checked separately on its official page.
Three readiness questions
When can service start?
After arrival and after a server becomes available.
Is waiting included in service time?
No. They are separate measures.
Does four-request evidence prove long-run performance?
No.
Use a workable pace
At 5 hours per week, allow about 2 weeks. Start with Stage 1, continue in order and reserve 2h for the capstone. If a gate fails, use its repair step before advancing. At another weekly budget, divide 510 estimated minutes by your available weekly minutes and round up.
Keep a small evidence folder. A checked box means you reviewed your output; it is not a certificate or proof that a provider lesson was watched.
The working case
Mean wait in the supplied sample
A fictional help desk receives four requests at minutes 0, 2, 4 and 8. Each takes 5 minutes. Work is first-come, first-served and cannot be interrupted. This deterministic sample is deliberately small; it is not a forecast of a real help desk.
| Request | Arrival minute | Service minutes |
|---|---|---|
| A | 0 | 5 |
| B | 2 | 5 |
| C | 4 | 5 |
| D | 8 | 5 |
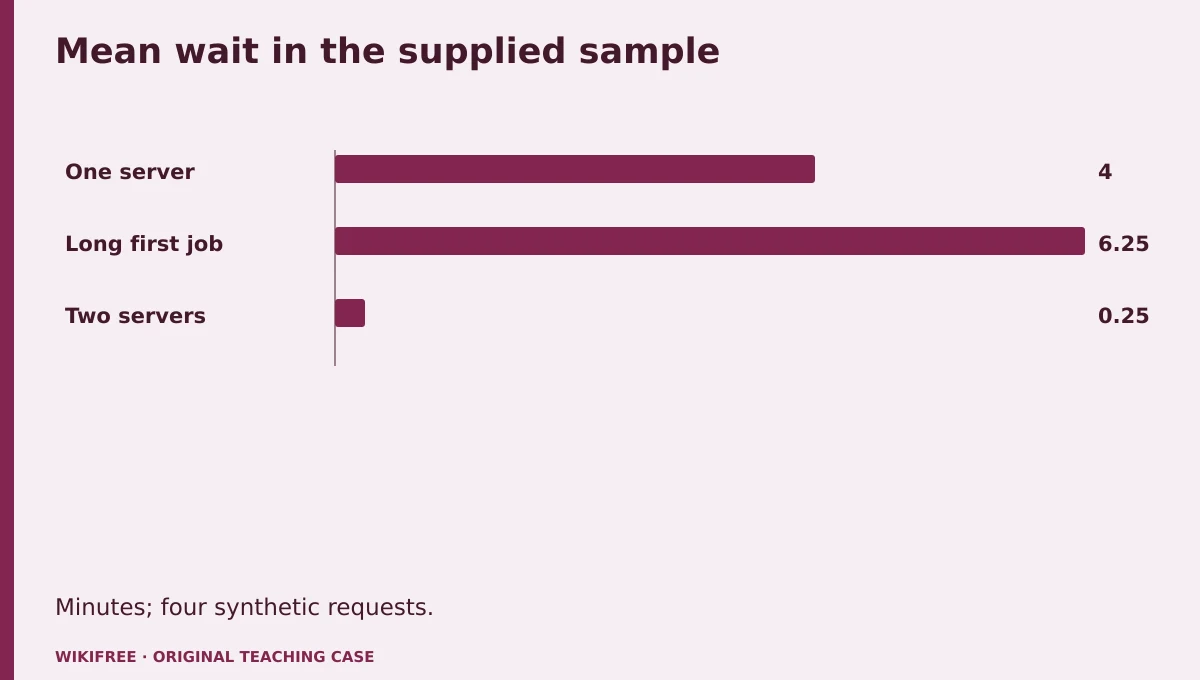
The table and explanations preserve the essential case information when the diagram is unavailable.
Your route
Five outputs, then a final handoff
- 01Define the flowQueue definition
About 1h 24m including assigned learning and practice. - 02Calculate the baseline queueBaseline queue table
About 1h 15m including assigned learning and practice. - 03Explore variabilityVariability scenario
About 1h 41m including assigned learning and practice. - 04Test a second serverTwo-server simulation
About 1h 15m including assigned learning and practice. - 05Write a measured improvement proposalQueue improvement brief
About 55m including assigned learning and practice. - FINALCapstone reviewCombine the evidence into one inspectable handoff.
About 2h .
0 of 6 outputs checked. JavaScript adds browser-only progress saving.
The complete lesson and all downloads remain available. Use the printable project workbook to track your progress.
Use the minimum useful source material
The courses behind this route
MIT
Free MIT Course: Lean Six Sigma and Process Improvement
MIT value-stream and variability lessons support the distinction between processing, waiting and flow; the queue simulation is original practice.
Selected material only; this path does not claim completion of the entire provider course.
Course publication and selected public lesson metadata were checked on 13 October 2026. This is not a claim of full video playback, provider-course completion or permanent availability. Recheck the linked source if a lesson changes.
Learn, make, inspect
The five-stage workshop
Define the flow
Video 34m · reading budget 0m · original practice about 50m.
Name the unit moving through the process and the points where the clock starts and stops. A request can wait even when its service duration is short. Keep arrival, start and finish as separate timestamps. Define the service discipline so the calculation is reproducible instead of silently prioritizing convenient cases.
Watch these selected lessons
Do the work
Draw the arrival–queue–service–completion sequence and state the rules.
Save this output
Queue definition
Pass the review gate
All four timestamps or durations have unambiguous units.
If you need another attempt
Use one clock origin and distinguish duration from timestamp.
Calculate the baseline queue
Video 0m · reading budget 0m · original practice about 1h 15m.
For one server, start is the later of arrival and the previous finish. Finish equals start plus service duration; waiting equals start minus arrival. Apply this recurrence row by row. Averages summarize the sample but can hide the longest wait, so report both mean and maximum.
Original application stage. Use your preceding outputs and the supplied case; there is no additional required provider lesson.
Do the work
Calculate start, finish, wait and total time for all requests.
Save this output
Baseline queue table
Pass the review gate
Starts are 0, 5, 10, 15; waits are 0, 3, 6, 7.
If you need another attempt
Recalculate from the first row instead of editing the final average.
Explore variability
Video 36m · reading budget 0m · original practice about 1h 5m.
The same average service time can produce different waits when long jobs occur at different points. Queue behavior depends on the sequence and available capacity. Do not apply a steady-state formula to this tiny finite sample without its assumptions. Use explicit scenarios to see the effect and describe their limited scope.
Watch these selected lessons
Do the work
Change request A to 8 minutes and D to 2, preserving total service time. Recalculate.
Save this output
Variability scenario
Pass the review gate
The revised waits are 0, 6, 9, 10 despite unchanged total service time.
If you need another attempt
Check that downstream starts inherit the earlier delay.
Test a second server
Video 0m · reading budget 0m · original practice about 1h 15m.
With two identical servers, assign the next request to the earliest available server and document a tie rule. More capacity can reduce waiting in this sample, but staffing has costs and demand may differ. Report the operational result before making a recommendation about actual staffing.
Original application stage. Use your preceding outputs and the supplied case; there is no additional required provider lesson.
Do the work
Simulate two servers with the original 5-minute jobs and assign ties to server 1.
Save this output
Two-server simulation
Pass the review gate
Waits are 0, 0, 1, 0 and the mean is 0.25 minutes.
If you need another attempt
Maintain separate availability times for the two servers.
Write a measured improvement proposal
Video 0m · reading budget 0m · original practice about 55m.
A useful proposal explains the measured baseline, the scenario effect and the next data needed. It should not promise the sample improvement in all future conditions. Plan to collect arrival and service timestamps over a representative period and inspect error handling before changing a real staffing schedule.
Original application stage. Use your preceding outputs and the supplied case; there is no additional required provider lesson.
Do the work
Write a brief comparing the three scenarios and a data-collection plan.
Save this output
Queue improvement brief
Pass the review gate
Sample results are clearly separated from future expectations.
If you need another attempt
Replace a universal claim with a statement limited to the supplied arrivals.
Make the result inspectable
Your final project
Deliver the three simulations, a timeline, reconciliation of service totals and an improvement brief. Add a fifth request at minute 8 and show how the documented tie rule makes the result reproducible.
The ZIP includes synthetic input data, a project workbook, worked reference, evidence log, scoring rubric and case-specific materials. Code projects include source and clearly stated local execution requirements.
Use one consistent rubric
| Criterion | Maximum | Evidence |
|---|---|---|
| Evidence and correctness | 30 | Calculations, source use and results match the supplied case; limitations are honest. |
| Required artifacts | 30 | All five stage outputs and the capstone handoff are present and inspectable. |
| Reasoning and decisions | 20 | Choices, assumptions, alternatives and the case-specific critical condition are explained. |
| Reproducibility | 10 | A reviewer can follow the stated steps and distinguish expected from observed results. |
| Clear communication | 10 | Labels, units, structure and evidence references make the work easy to review. |
Score at least 80/100, supply every required artifact, and satisfy the path-specific critical condition. Rework missing evidence before marking complete.
The critical condition
No request starts before arrival or before its assigned server is free.
Compare with a worked reference
The one-server mean wait is (0 + 3 + 6 + 7) / 4 = 4 minutes; maximum wait is 7. The two-server case has a mean of 0.25. Front-loading variability changes the one-server mean to 6.25 even though total service remains 20 minutes.
Know the boundary
This covers a finite deterministic queue, not stochastic capacity forecasting or a validated staffing recommendation.
Questions before you finish
Do I need to finish every source course?
No. This path names selected lessons or reading sections. Complete the full provider course only if it supports your wider goal. The path does not claim equivalence to that course.
How do I know when to advance?
Use the output and review gate in each stage. If evidence is missing or a result conflicts with the case, follow the repair step and retry before advancing.
Can I do the project without paid software?
The selected public provider lessons are free to view. The original case can be completed with paper, a text editor or freely available local tools. Paid exams, certificates, subscriptions and optional provider software are not required for this project.
What does my checklist prove?
It records your own review in this browser only. It does not verify viewing, skill, a provider credential or a real-world deployment.
What if a lesson or tool changes?
Use the linked course and provider page to inspect current availability. Record the change and revisit the relevant assignment; do not invent a replacement lesson or claim an unavailable activity was completed.
Questions & discussion
Share a useful question or correction. Comments appear after moderation. Please avoid personal or sensitive information.