Path 91 · The loading budget · Intermediate
Measure the page before promising speed.
A guided, practical route through web performance.
What you will be able to do
Create a resource budget and an optimization plan, then compare local page behavior without claiming an unmeasured performance score.
Plan about 9h 45m in total. Reading and practice are editorial estimates; video runtimes come from public provider metadata. Your pace will vary.
Table of Contents
Before you begin
Check your starting point
What you need
Basic HTML, CSS and browser developer tools. No paid monitoring service is required.
The selected public provider lessons are free to view. The original case can be completed with paper, a text editor or freely available local tools. Paid exams, certificates, subscriptions and optional provider software are not required for this project.
Completing this Coursya path does not award a provider certificate. Any provider assessment, account requirement or credential must be checked separately on its official page.
Three readiness questions
Does fewer bytes guarantee every user sees a faster page?
No. Rendering, network and device conditions also matter.
Is a local test a field measurement?
No.
Can a score be promised without running its test?
No.
Use a workable pace
At 5 hours per week, allow about 2 weeks. Start with Stage 1, continue in order and reserve 2h for the capstone. If a gate fails, use its repair step before advancing. At another weekly budget, divide 585 estimated minutes by your available weekly minutes and round up.
Keep a small evidence folder. A checked box means you reviewed your output; it is not a certificate or proof that a provider lesson was watched.
The working case
A proposed resource budget
A fictional workshop page has a teaching resource budget: HTML 100 kB, images 800 kB and JavaScript 300 kB. A proposed revision keeps HTML at 100, reduces images to 240 and JavaScript to 120. These are scenario values, not measured network transfers from Coursya.
| Resource | Before kB | Proposed kB |
|---|---|---|
| HTML | 100 | 100 |
| Images | 800 | 240 |
| JavaScript | 300 | 120 |
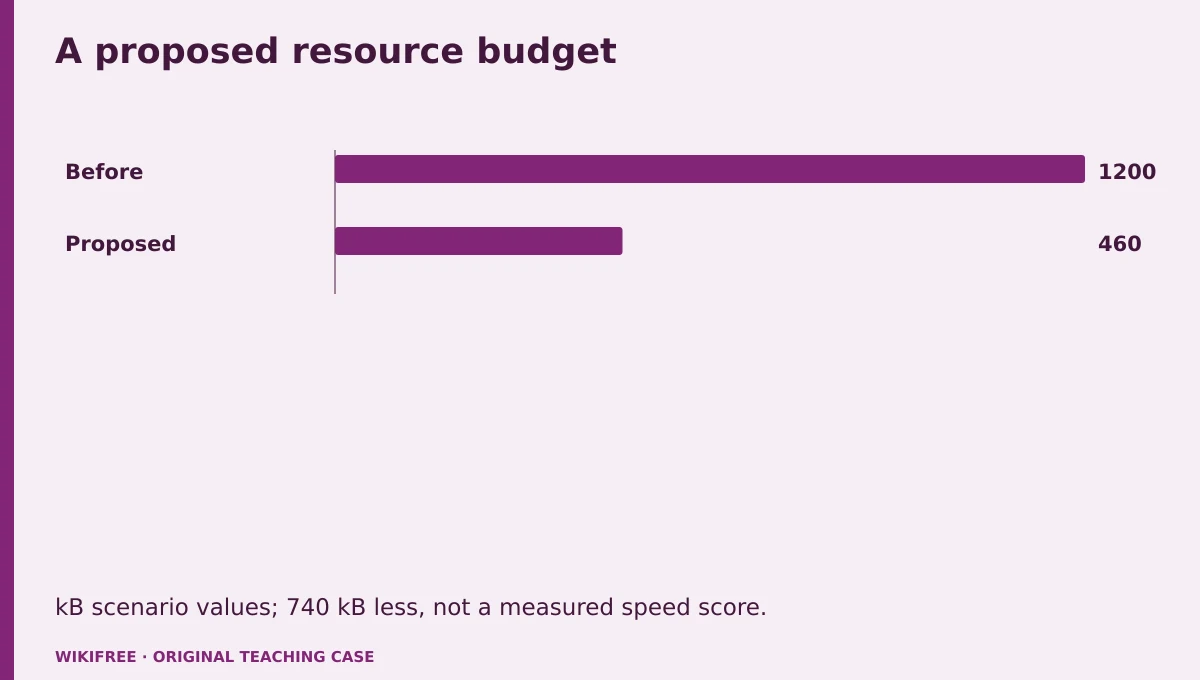
The table and explanations preserve the essential case information when the diagram is unavailable.
Your route
Five outputs, then a final handoff
- 01Define the performance questionPerformance brief
About 1h 30m including assigned learning and practice. - 02Inspect the loading pathLoading map
About 1h 55m including assigned learning and practice. - 03Set a resource budgetResource budget table
About 2h including assigned learning and practice. - 04Run a controlled comparisonMeasurement log
About 1h 25m including assigned learning and practice. - 05Write a prioritized improvement planPerformance handoff
About 55m including assigned learning and practice. - FINALCapstone reviewCombine the evidence into one inspectable handoff.
About 2h .
0 of 6 outputs checked. JavaScript adds browser-only progress saving.
The complete lesson and all downloads remain available. Use the printable project workbook to track your progress.
Use the minimum useful source material
The courses behind this route
Google Learn Performance: Free Web Performance Course
The published web.dev performance course covers the loading path, resource priorities, images and JavaScript.
Selected material only; this path does not claim completion of the entire provider course.
Course publication and selected public lesson metadata were checked on 13 October 2026. This is not a claim of full video playback, provider-course completion or permanent availability. Recheck the linked source if a lesson changes.
Learn, make, inspect
The five-stage workshop
Define the performance question
Video 0m · reading budget 35m · original practice about 55m.
Specify the user task, device conditions and page state before measuring. A page can transfer few bytes yet block interaction with expensive script work. Separate laboratory tests from real-user field data. The case begins with a hypothetical byte budget so calculations stay distinct from browser observations.
Assigned reading
Google Learn Performance: Free Web Performance Course: Why speed matters and general HTML performance considerations.
Use the named provider navigation sections. Editorial reading budget for the named public material; not a verified completion duration
Do the work
Write a measurement plan and list the scenario assumptions.
Save this output
Performance brief
Pass the review gate
Hypothetical byte values are not labeled measured.
If you need another attempt
Add the test conditions beside every future measurement field.
Inspect the loading path
Video 0m · reading budget 45m · original practice about 1h 10m.
The browser discovers and processes resources in an order affected by HTML, CSS and scripts. Identify resources needed for the first useful view and those that can wait. Avoid adding preload hints blindly; prioritizing everything defeats prioritization. Keep the core lesson text available without JavaScript.
Assigned reading
Google Learn Performance: Free Web Performance Course: Understanding the critical path and optimize resource loading.
Use the named provider navigation sections. Editorial reading budget for the named public material; not a verified completion duration
Do the work
Annotate the local fixture’s critical and deferred resources.
Save this output
Loading map
Pass the review gate
Each proposed deferral preserves the essential content.
If you need another attempt
Test the page with scripting unavailable before calling it resilient.
Set a resource budget
Video 0m · reading budget 45m · original practice about 1h 15m.
A budget makes regressions discussable. Calculate the proposed savings and identify which assets change. Optimize images with suitable dimensions and encoding, and remove unnecessary script work. The scenario does not justify a claim about Core Web Vitals or a particular PageSpeed score.
Assigned reading
Google Learn Performance: Free Web Performance Course: Image performance and JavaScript performance material.
Use the named provider navigation sections. Editorial reading budget for the named public material; not a verified completion duration
Do the work
Calculate category savings and the total reduction.
Save this output
Resource budget table
Pass the review gate
Total changes from 1,200 to 460 kB, a 61.67% reduction.
If you need another attempt
Compute percentage savings against the original total.
Run a controlled comparison
Video 0m · reading budget 0m · original practice about 1h 25m.
Use the same browser conditions and repeat a test rather than selecting the best run. Record what actually happened, including cache state and viewport. The supplied local fixture lets you inspect resource and rendering behavior; it is not a clone of a live production page.
Original application stage. Use your preceding outputs and the supplied case; there is no additional required provider lesson.
Do the work
Record three local runs for the fixture and report the range, if the tools are available.
Save this output
Measurement log
Pass the review gate
No unperformed metric is filled with an estimate disguised as a result.
If you need another attempt
Leave unavailable measurements blank with a reason.
Write a prioritized improvement plan
Video 0m · reading budget 0m · original practice about 55m.
Prioritize changes by expected user benefit, effort and confidence. Separate measured bottlenecks from hypotheses and include a regression check. A performance change should not remove accessibility, content or necessary functionality. State what must be measured after a real deployment before claiming an improvement for users.
Original application stage. Use your preceding outputs and the supplied case; there is no additional required provider lesson.
Do the work
Write three actions and an acceptance check for each.
Save this output
Performance handoff
Pass the review gate
The plan includes a post-change comparison under the same conditions.
If you need another attempt
Replace guaranteed score claims with measurable acceptance criteria.
Make the result inspectable
Your final project
Deliver the measurement plan, loading map, budget calculation, actual local observations and prioritized actions. Explain one optimization that would be inappropriate for above-the-fold content.
The ZIP includes synthetic input data, a project workbook, worked reference, evidence log, scoring rubric and case-specific materials. Code projects include source and clearly stated local execution requirements.
Use one consistent rubric
| Criterion | Maximum | Evidence |
|---|---|---|
| Evidence and correctness | 30 | Calculations, source use and results match the supplied case; limitations are honest. |
| Required artifacts | 30 | All five stage outputs and the capstone handoff are present and inspectable. |
| Reasoning and decisions | 20 | Choices, assumptions, alternatives and the case-specific critical condition are explained. |
| Reproducibility | 10 | A reviewer can follow the stated steps and distinguish expected from observed results. |
| Clear communication | 10 | Labels, units, structure and evidence references make the work easy to review. |
Score at least 80/100, supply every required artifact, and satisfy the path-specific critical condition. Rework missing evidence before marking complete.
The critical condition
Scenario estimates and measured browser results are clearly separated; no performance score is fabricated.
Compare with a worked reference
The proposed total is 100 + 240 + 120 = 460 kB, compared with 1,200 kB. Savings are 740 kB or 61.67%. This is a resource-budget calculation, not a measured load-time or PageSpeed result.
Know the boundary
This is a local performance exercise, not a live-site optimization or a guarantee of field metrics.
Questions before you finish
Do I need to finish every source course?
No. This path names selected lessons or reading sections. Complete the full provider course only if it supports your wider goal. The path does not claim equivalence to that course.
How do I know when to advance?
Use the output and review gate in each stage. If evidence is missing or a result conflicts with the case, follow the repair step and retry before advancing.
Can I do the project without paid software?
The selected public provider lessons are free to view. The original case can be completed with paper, a text editor or freely available local tools. Paid exams, certificates, subscriptions and optional provider software are not required for this project.
What does my checklist prove?
It records your own review in this browser only. It does not verify viewing, skill, a provider credential or a real-world deployment.
What if a lesson or tool changes?
Use the linked course and provider page to inspect current availability. Record the change and revisit the relevant assignment; do not invent a replacement lesson or claim an unavailable activity was completed.
Questions & discussion
Share a useful question or correction. Comments appear after moderation. Please avoid personal or sensitive information.